Guide
What to monitor on a GPU box
Most AI teams monitor the application and the model, and almost nothing between them and the hardware. Four signals explain the majority of incidents, and none of them is model quality.
- Topic
- Observability
- Reading
- About 8 minutes
- Published
- 4 August 2026
- Applies to
- All plans
Contents
The short version
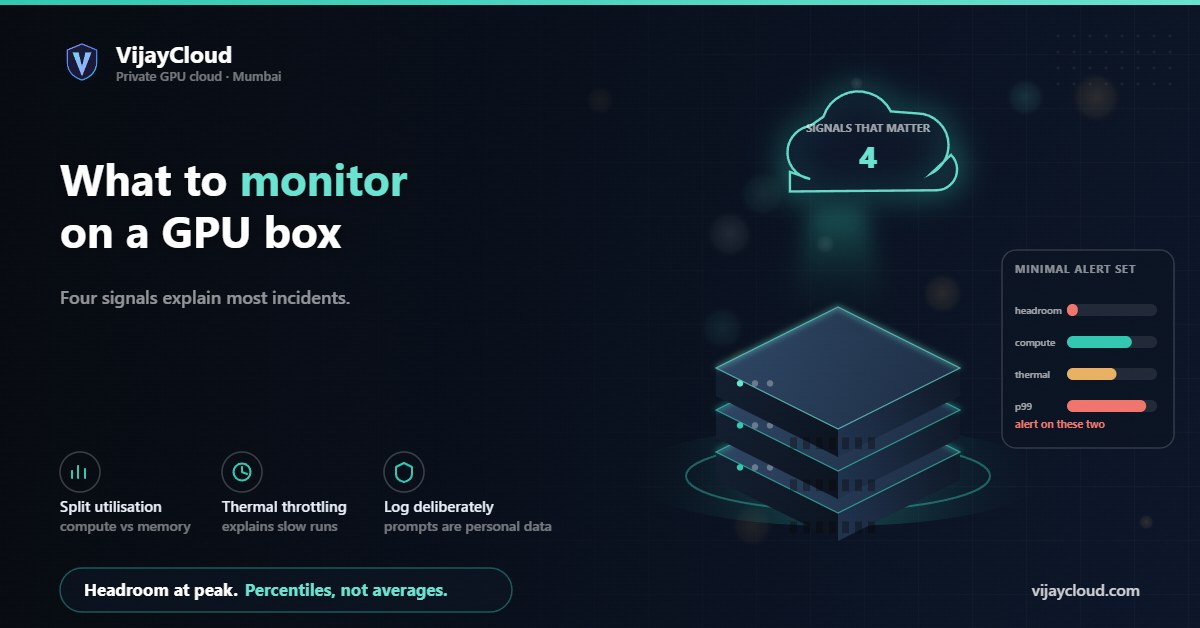
Watch memory headroom at peak, compute utilisation separately from memory occupancy, thermals and power draw for throttling, and latency percentiles rather than averages. Alert on headroom and on the ninety-ninth percentile. Be deliberate about what you log, because prompt logs are personal data.
01The gap in most setups
Teams typically have application metrics on one side — requests, errors, response times — and model evaluation on the other. Between them sits the layer that causes most incidents, and it is frequently unmonitored.
The symptom is a familiar conversation: the service got slow, the application logs show nothing unusual, the model has not changed, and nobody can say why. The answer is usually visible in four hardware-adjacent signals that nobody was recording.
02Memory headroom, at peak rather than on average
The single most useful number. Not average memory use, which is reassuring and meaningless, but the minimum free memory observed at peak.
Out-of-memory failures are not gradual. A service runs correctly at eighty per cent occupancy and fails at ninety-eight, and the transition can be one unusually long request. Average utilisation of sixty per cent tells you nothing about whether that happened.
Record minimum free memory per interval and alert on it. If headroom regularly drops below about ten per cent you are one traffic spike from failures, and the fix is a capacity or configuration decision rather than a monitoring one. Our post on KV cache sizing explains why this number moves the way it does.
03Utilisation, split three ways
“GPU utilisation” is reported as one number and means at least three different things. Conflating them produces wrong conclusions in both directions.
| Signal | High means | Low means |
|---|---|---|
| Compute utilisation | The arithmetic units are busy | Something else is the bottleneck |
| Memory occupancy | VRAM is committed | Room for more concurrency |
| Occupancy over time | The card is rarely idle | Capacity is going unused |
The diagnostic combinations matter more than any single value. High memory with low compute is the signature of a memory-bound serving workload, or of agents waiting on tools. Low memory with low compute during a training run points at the data pipeline rather than the GPU. High compute with low throughput suggests inefficient kernels or too-small batches.
Our post on the utilisation problem covers what to do once you can see which case you are in.
04Thermals and power
These are the signals people record and never look at, and they explain a specific and confusing failure: throughput that degrades over the course of a long run with no change in code or data.
A GPU under sustained load will reduce its clocks to stay within thermal and power limits. Nothing errors. Nothing logs. Steps simply take longer, and if you are only watching step time you will look for the cause in your software.
Record die temperature and power draw alongside step time. If temperature climbs and clocks fall together, you have your answer, and it is an environmental question rather than a code one. On single-tenant hardware this is attributable; on shared hardware you cannot distinguish your own thermal behaviour from a neighbour’s, which is one of the practical arguments for knowing what tenancy you have.
05Queue depth and latency percentiles
For a serving workload, two application-side signals matter more than anything on the card.
Queue depth is the earliest warning you get. It rises before latency does, because requests wait before they slow down. A queue that is growing rather than oscillating means arrival rate has exceeded service rate, and no amount of per-request optimisation will fix that.
Latency percentiles, not averages. The mean is dominated by the easy requests. Track the fiftieth, ninety-fifth and ninety-ninth percentiles, and track time-to-first-token separately from total generation time — for an interactive product they are different user experiences and can move in opposite directions.
06What to alert on
Most teams alert on too much and then ignore the alerts. Four are enough to start.
| Alert | Why this one |
|---|---|
| Minimum free VRAM below ten per cent | The precursor to hard failures |
| Ninety-ninth percentile latency above budget | Catches degradation the mean hides |
| Queue depth growing over several intervals | Distinguishes overload from a spike |
| Sustained clock reduction under load | Explains slow runs with no code change |
Deliberately not on the list: average GPU utilisation. It is a capacity-planning metric, not an incident signal, and alerting on it produces noise.
07Logging without creating a liability
The instinct when debugging model behaviour is to log prompts and completions. That is useful and it creates an obligation, so it deserves a decision rather than a default.
Prompt and completion logs frequently contain personal data. Under India’s DPDP Act that makes them subject to the duties that apply to any personal data you hold: purpose limitation, retention limits, security safeguards and the ability to respond to erasure requests. A debug log with no retention policy is a store of user text with your name on it.
Three decisions worth making explicitly: what is logged, for how long, and who can read it. Sampling rather than logging everything, redacting before storage, and setting a short retention window handle most cases without losing the debugging value.
Our post on where your prompts actually go covers this in more depth, including why moving inference in-house shifts the risk rather than removing it.
If you want a second opinion on a monitoring plan before you build it, describe the setup: contact@vijaycloud.com.
Leave a Reply