Guide
Alert storms: grouping matters more than thresholds
One failure rarely produces one alert. Tuning individual thresholds treats the symptom; the fix is deciding what belongs to the same cause.
- Topic
- Operations
- Reading
- About 6 minutes
- Published
- 13 August 2026
- Applies to
- Starter, Professional
Contents
The short version
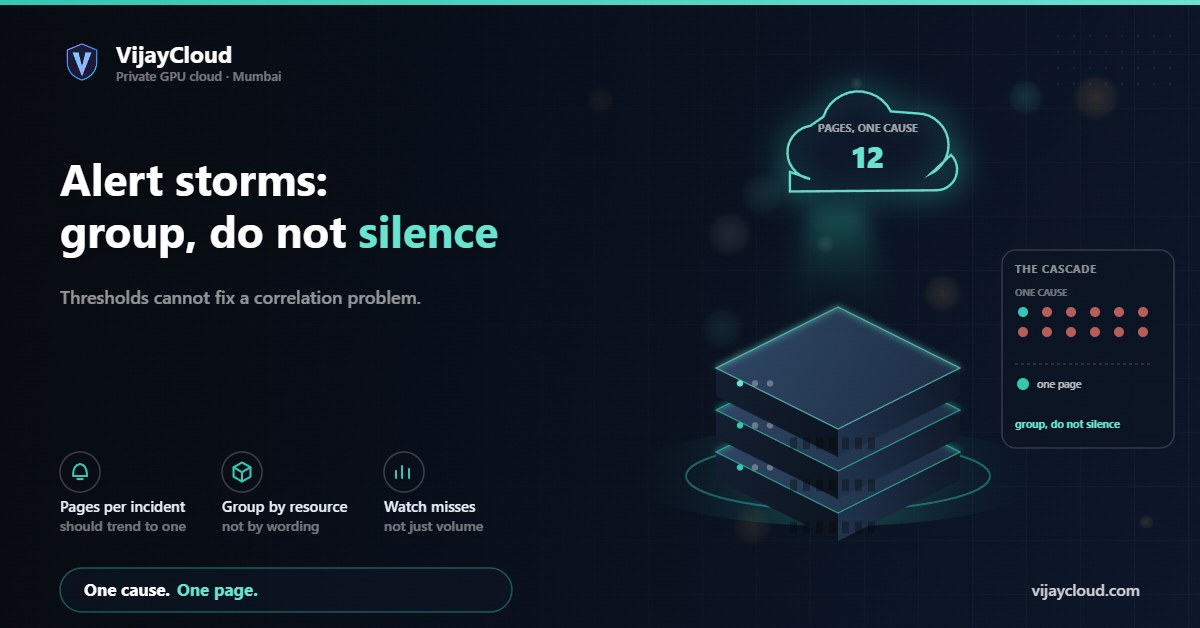
A single fault propagates, so one cause becomes many alerts. Raising thresholds hides real problems; grouping does not. Group by causal proximity — same host, same dependency, same deploy, overlapping time window — rather than by text similarity, and page once per group. Judge the result by pages per incident and by how many real problems you missed, not by total alert volume.
01One cause, forty pages
A GPU node runs out of memory. The training job on it dies, so the job-failure alert fires. The node stops reporting, so the heartbeat alert fires. The scheduler reassigns work, so queue depth spikes on three other nodes and their latency alerts fire. A downstream service times out waiting for inference, so its error-rate alert fires. The dashboard that watches the dashboard notices the alert rate and fires too.
One cause. Roughly a dozen notifications, spread across four teams, none of which says “a node ran out of memory”. Whoever is on call now has to reconstruct that sentence from the wreckage, at whatever hour it happened.
This is the problem every AI operations vendor leads with, and they are right to. It is also mostly not a threshold problem, which is where teams usually try to fix it first.
02Why tuning thresholds makes it worse
The instinct after a noisy night is to raise thresholds. It works, briefly, and then produces a worse failure: the alert that was too sensitive is now too dull, and the next real incident arrives silently.
The deeper issue is that thresholds are per-signal and faults are not. Each alert is individually correct — the job did fail, the node did stop reporting, the queue did grow. There is no threshold setting that makes twelve true statements into one useful one. You cannot fix a correlation problem with a sensitivity knob.
The other common attempt is a blanket rate limit: no more than N pages per hour. That reduces volume without reducing confusion, and it silently drops the one alert that mattered when it happens to arrive thirteenth.
03Group by cause, not by similarity
Most naive grouping clusters alerts that look alike — same title, similar text. That catches the easy case of one alert firing repeatedly and misses the case that actually hurts, where a dozen differently worded alerts share one cause.
Useful grouping asks whether two alerts are causally close, using signals you already have:
- Same resource. Alerts naming the same host, node, pod or GPU index almost certainly belong together.
- Dependency adjacency. If service B calls service A, an error in B within a short window of an error in A is one event, not two.
- Time proximity, but bounded. A window of a few minutes catches propagation; an hour catches coincidence. Cascades are fast.
- Same recent change. If a deploy touched all the affected services in the last half hour, that is the group and probably the cause.
Notice that three of those four require you to know your topology — what calls what, what runs where, what was deployed. That is the “production context” every vendor in this space talks about building. You can build a usable version of it yourself from your service registry and deploy log, and it is worth doing regardless of whether you buy anything, because it is what makes any of this possible.
04What this looks like on a GPU fleet
AI infrastructure has a few cascade patterns worth encoding explicitly, because they recur and they are easy to recognise once named.
| Root cause | Fans out into | Page on |
|---|---|---|
| Out-of-memory on one GPU | Job failure, heartbeat loss, queue depth elsewhere, downstream timeouts | The OOM |
| Dataloader or storage stall | Low GPU utilisation, step-time regression, epoch overrun | The storage latency |
| Thermal throttling | Throughput drop, latency percentiles, SLA breach | The temperature |
| KV cache exhaustion | Request rejections, retry storm, upstream error rate | The cache pressure |
| Node drain or reboot | Every job on it, plus rebalancing noise on peers | The node event |
The right-hand column is the alert a human should receive. Everything else in that row is evidence, useful once you are looking, actively harmful as a notification. The distinction between “page me” and “attach this to the page” is the single highest-value change most teams can make to their alerting.
05Measuring whether it worked
The metric people reach for is total alert volume, and it is the wrong one: you can halve it by breaking your monitoring. Two better ones, tracked together:
Pages per incident. How many separate notifications a human received for one underlying cause. This should trend towards one. It is the number that actually reflects on-call quality.
Missed incidents. How many real problems reached users without paging anyone. This must not rise. If pages per incident falls while missed incidents rises, you have not improved grouping, you have suppressed alerts.
Vendors in this space publish large noise-reduction figures. Those numbers are measuring the first metric in isolation, which is the easy half. When you evaluate a tool, ask what happened to the second, and ask it about your own trial data rather than their benchmark. A tool that reduces pages by ninety percent and misses one outage a quarter has not helped you.
06Where to start
You do not need an agent to get most of this. In order of value per hour spent:
- Write down your dependency map. Even a rough one. Nothing else works without it.
- Split alerts into page and attach. Most existing alerts should become evidence, not notifications.
- Group by resource first. Same node, same group. This alone kills the largest class of storm on a GPU fleet.
- Add deploy correlation. Tag every alert with the last change to the affected service.
- Then consider tooling. With the map and the split in place you can actually evaluate whether an agent adds anything, because you have a baseline.
If your GPU workloads are the thing generating the storms and you want a second opinion on what should page and what should not, email contact@vijaycloud.com — we run this hardware ourselves and are happy to compare notes on what actually turned out to be worth waking up for.